The interactive capabilities of Jupyter Notebooks make them an easy choice for visualizing weather data and interacting with weather maps, charts, and tables. Additionally, Python’s simple syntax and immense community of open source libraries increase the attraction between developers (or data scientists) and the technology.
A standard Python mapping library is folium. The library allows users to create dynamic maps in Jupyter Notebooks using Python and Leaflet.js.
Leaflet.js is “an open-source JavaScript library for mobile-friendly interactive maps.”
Utilizing folium and its underlying Leaflet functionality, we can add data layers on top of satellite, terrain, or transit map tiles that automatically fetch data from providers like Tomorrow.io.
Consequently, we can overlay dozens of data layers onto an interactive map in a small amount of time. Let’s explore how to use folium with the Tomorrow.io Weather API to add data layers onto interactive maps.
Prerequisites
- Have access to Anaconda (https://www.anaconda.com/products/individual), Visual Studio Code (https://code.visualstudio.com/docs/python/jupyter-support), or another application that allows you to download and run Jupyter Notebooks.
- Know how to install Python packages
- Knowledge of basic Python programming knowledge
- Have a Tomorrow.io API Key
How to Interact with Maps and Weather Data in Jupyter Notebook Using Python
1. Install Python Packages
Install the required Python packages into your local or global Python virtual environment. Open up a new Jupyter Notebook, and in the first cell, import the packages that we want for the tutorial.
from datetime import datetime
from folium import Map, LayerControl
from folium.raster_layers import TileLayer
from folium.plugins import FloatImage
Run the cell and wait for the packages to import.
2. Initialize the Map and API Variables
In the next cell we define a few variables that help us build the map and call the API.
# Starting center of map
center = (47.000, -119.000) # somewhere in eastern Washington

# Tomorrow.io API Key
apikey = 'add your api key here'

# Current time
time = datetime.now().isoformat(timespec='milliseconds') + "Z"
# '2021-06-02T10:02:06.828Z'
3. Create Base Map
Then, we can initialize a base map, passing in configuration options.
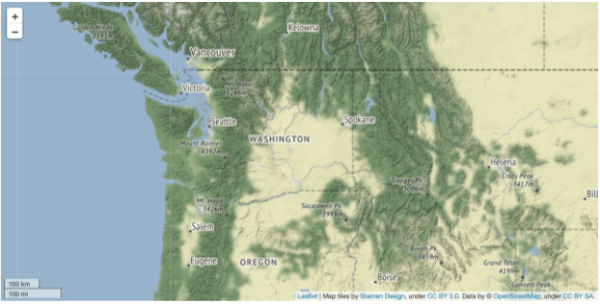
pnw = Map(
   location=center,
   min_zoom=1,
   max_zoom=12,
   zoom_start=6,
   tiles="Stamen Terrain",
   height=500,
   width=1000,
   control_scale=True
)

# Show map
pnw
After running the cell, your output map should look like the image below.
4. Create Temperature Layer with Tomorrow.io
Now we can overlay the temperature tiles.
temperature = TileLayer(
    name='Temperature',
tiles='https://api.tomorrow.io/v4/map/tile/{z}/{x}/{y}/temperature/{time}.png?apikey={apikey}',
    min_zoom=1,
    max_zoom=12,
    max_native_zoom=12,
    overlay=True,
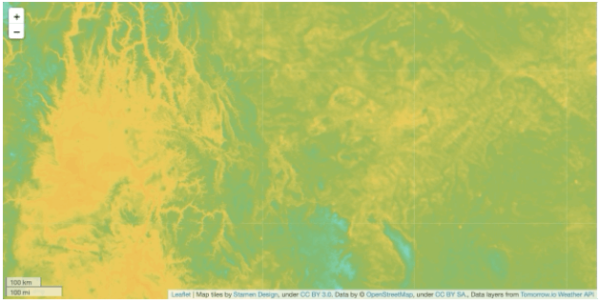
Take a look at the tiles argument. We’re passing in a custom URL that matches the expected format in Tomorrow.io’s documentation. Also important, the x, y, and z variables are passed into the URL by folium. However, we are providing the time and apikey variables as keyword arguments.
Run the cell. Then, adjust the zoom (or pan to a different area) and watch the temperature spectrum overlay the base map tiles! The folium library automatically makes calls to the API, retrieving the necessary tiles.
5. Add Layer Control
The last step is to add a layer control menu to control when to show the temperature tiles.
In a new cell, add the code:
LayerControl(position='topright').add_to(pnw)

# Show map
pnw
Again, run the cell. You should have a control menu in the top right of the map, giving you the option to toggle the temperature tiles.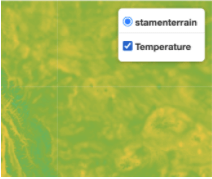
Conclusion
In the article, we introduced the Python library folium and how it works with Leaflet to create interactive maps in Jupyter Notebooks.
Then, with only a few lines of code, we created a map, added detailed temperature data, and gave the map user controls.